
Spectroscopy is based on how matter interacts with radiation, where molecules or atoms absorb, emit, or scatter specific wavelengths of light. These interactions create characteristic spectral lines that serve as fingerprints for identifying substances and understanding their properties. You can analyze energy levels and changes, using instruments like prisms or diffraction gratings to disperse light, and detectors to measure signals. Proceeding explores how these principles reveal details about molecular structure and environmental conditions.
Key Takeaways
- Spectroscopy involves the interaction of electromagnetic radiation with matter, including absorption, emission, scattering, reflection, and transmission.
- Different types of radiation (radio, visible, UV, IR, X-ray) provide information about molecular and atomic energy levels.
- Transitions between discrete energy states produce characteristic spectral lines, serving as fingerprints for identifying substances.
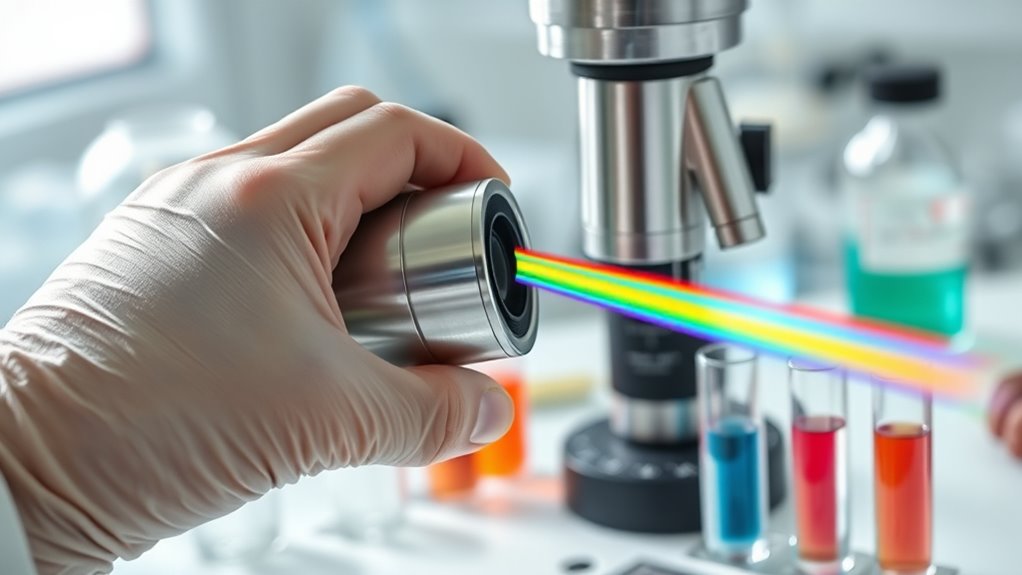
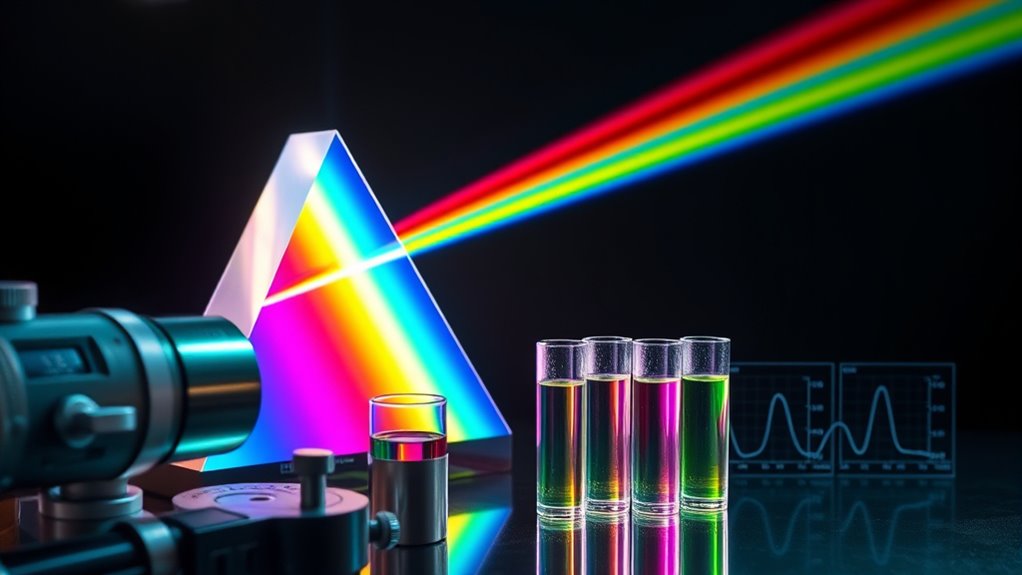
- Instruments like prisms, diffraction gratings, and interferometers disperse radiation to analyze its spectral components.
- Data analysis involves measuring parameters such as frequency, resolution, and peak intensities to interpret molecular and atomic structures.
Top picks for "basic principl spectroscopy"
Open Amazon search results for this keyword.
As an affiliate, we earn on qualifying purchases.
Fundamental Concept of Matter and Radiation Interaction

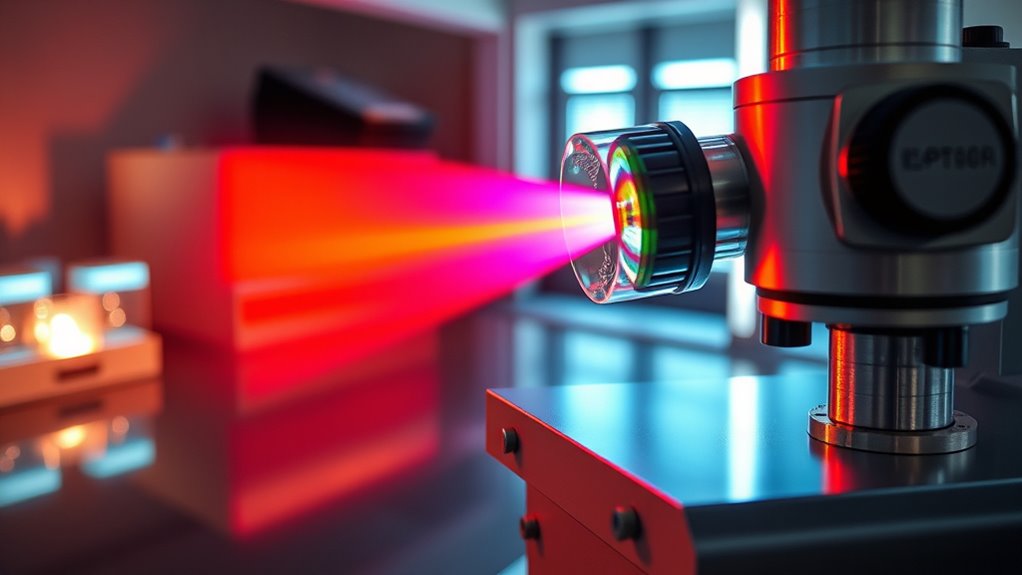
Understanding how matter interacts with radiation is essential in spectroscopy, as it reveals the fundamental processes governing energy exchange. Electromagnetic radiation covers a broad spectrum, from radio waves to gamma rays, with properties like wavelength, frequency, energy, and momentum. Depending on its energy, radiation acts either like a wave or a particle—waves dominate at low energies, and particles, or photons, at high energies. Matter interacts with radiation through various mechanisms, including absorption, scattering, reflection, emission, and transmission. The energy of photons also determines how deeply radiation can penetrate materials and which specific molecular or atomic transitions are excited. These interactions help us analyze and identify materials, detect particles, and understand biological effects. Recognizing how different types of radiation influence matter is crucial for applications across science, medicine, and environmental studies, making this foundational knowledge key to mastering spectroscopy. Additionally, understanding the properties of electromagnetic radiation varies across the spectrum and affects how energy transfer occurs at the atomic and molecular levels, with spectroscopic techniques relying heavily on these properties to probe matter with high precision.
A deeper comprehension of the interaction mechanisms involved at different energy levels enables the development of more refined and advanced spectroscopic methods, which can reveal even subtler details about material structures.
Absorption and Emission Processes in Spectroscopy
Absorption and emission processes are fundamental to spectroscopy because they explain how atoms and molecules interact with electromagnetic radiation. When you shine light on a sample, atoms or molecules can absorb photons, causing electrons to jump from lower to higher energy states. This absorption is measured as an increase in energy at specific wavelengths, forming an absorption spectrum. These processes are crucial for understanding material properties and are widely utilized across various scientific disciplines.
Conversely, when electrons return to lower energy levels, they emit photons, creating an emission spectrum. Emission can occur through various mechanisms like fluorescence or incandescence, producing characteristic spectral lines or bands. On-device AI capabilities integrated into modern instruments can enhance the analysis and interpretation of spectral data.
These processes allow you to identify substances and determine their concentrations. Spectroscopy techniques utilize these principles across the electromagnetic spectrum, providing vital insights into the composition and behavior of different materials.
Quantum Mechanical Foundations of Spectral Properties
The quantum mechanical foundation of spectral properties explains how atoms and molecules exhibit discrete energy levels, leading to the characteristic spectral lines observed in spectroscopy. You learn that wave functions (Ψ) describe quantum states, with |Ψ|² giving the probability density for particle positions. Stationary states, solutions to the Schrödinger equation, define these discrete energy levels. The uncertainty principle limits measurement precision, affecting spectral line widths. Progression between quantized energy levels produce spectral lines, modeled by time-dependent perturbation theory. Allowed advancement follow selection rules, and their probabilities depend on dipole moments. Quantum states—electronic, vibrational, rotational, and spin—dictate spectral features. Understanding these principles helps interpret spectral data and connect observed lines to underlying quantum phenomena. Additionally, the development of robust safety measures is crucial in preventing vulnerabilities in AI systems used across scientific research. Recognizing the influence of local laws can help in designing experiments and interpreting data more effectively. Establishing effective spectroscopy techniques also enhances the accuracy of spectral analysis and interpretation, while ongoing research into instrument calibration is vital for improving measurement reliability.
Energy Levels and Transitions in Atoms and Molecules

Atoms and molecules exhibit distinct energy levels due to their quantum nature, which arise from the solutions to their electronic, vibrational, and rotational Schrödinger equations. In atoms, electrons occupy discrete electronic states determined by quantum numbers, with changes between these states involving photon absorption or emission matching the energy difference ((E = hnu)).
Atoms produce sharp spectral lines, like hydrogen’s Balmer series, reflecting these quantized transitions.
Molecules involve electronic, vibrational, and rotational energy levels that often couple, resulting in complex spectra. Vibrational levels follow the quantum harmonic model, with decreasing spacing at higher energies due to anharmonicity, while rotational levels depend on the molecule’s moment of inertia.
Transitions follow specific selection rules, enabling the identification of atomic and molecular species in spectroscopic studies.
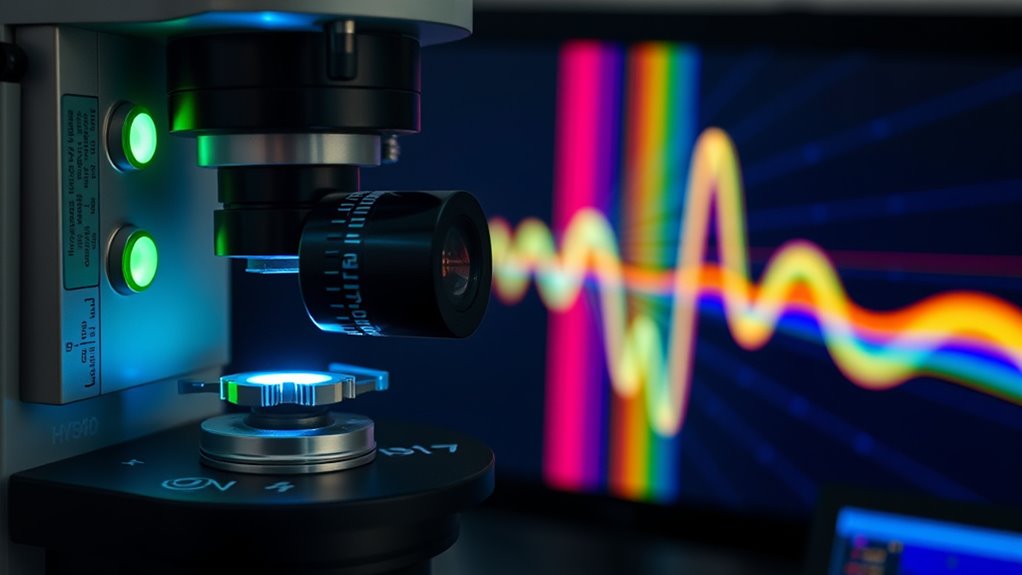
Spectral Lines: Characteristics and Significance
Spectral lines are key indicators of the physical conditions and composition of astronomical objects, forming when atoms or molecules emit or absorb photons at specific frequencies. Emission lines occur as atoms or molecules transition from higher to lower energy states, releasing photons. Absorption lines happen when cool gas absorbs photons passing through it, creating dark features in spectra. Each line results from a unique quantum transition, enabling precise element identification and chemical fingerprinting, like helium at 587.6 nm or calcium near 394 nm. Line characteristics, such as broadening from Doppler effects or pressure, reveal information about temperature, density, and turbulence. Spectral lines are highly sensitive to environmental factors, making them important diagnostic tools. These lines also serve as tools for measuring velocities, redshifts, and magnetic fields, making spectral lines essential for understanding astrophysical processes and cosmic environments.
Role of Electromagnetic Spectrum in Spectroscopic Techniques
Electromagnetic radiation interacts with matter in various ways that underpin many spectroscopic techniques. You’ll see absorption when electrons or molecules transition between energy levels, as in UV-Vis or IR spectroscopy. Additionally, emission occurs when excited electrons release radiation, like in fluorescence. Scattering redirects radiation through elastic (Rayleigh) or inelastic (Raman) processes, revealing molecular details. Resonance involves nuclear spins aligning with radiofrequency fields, fundamental in NMR spectroscopy. Transmission measures how much radiation passes through a sample, helping determine absorption or transmittance ratios, pivotal in IR analysis. Different spectrum regions suit specific techniques: radio waves for NMR, infrared for vibrational modes, visible/UV for electronic transitions, and X-rays for crystal structures. The interaction mechanisms vary depending on the wavelength and the type of matter involved, which influences the choice of spectroscopic method. Understanding these interactions helps you select the right method to analyze material properties effectively.
How Spectrometers Disperse and Detect Radiation
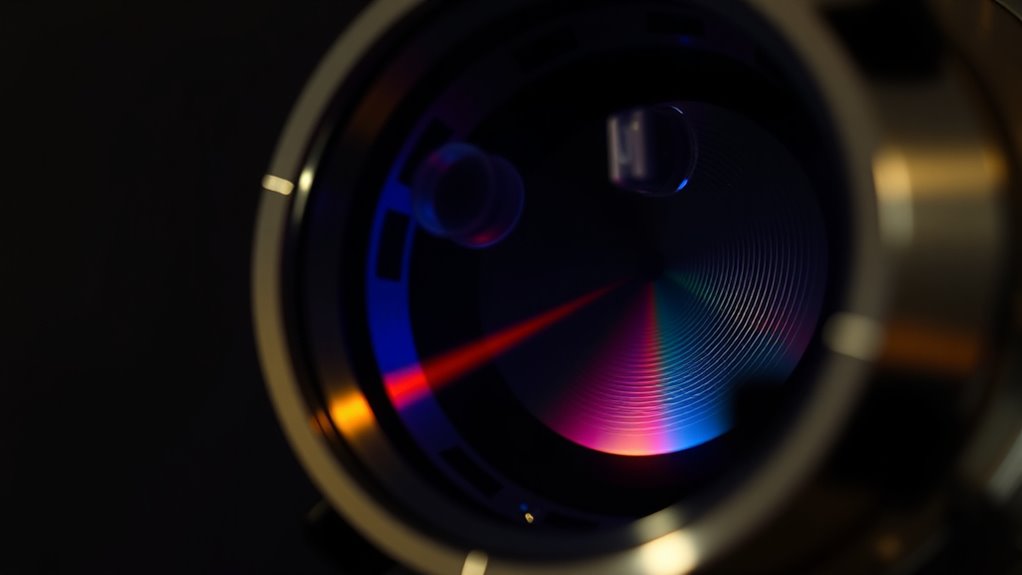
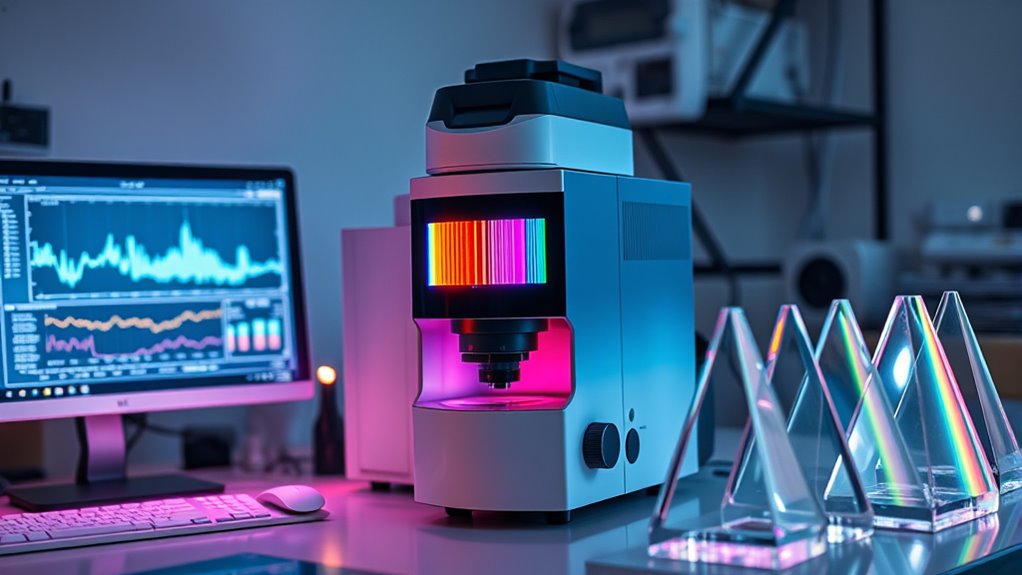
Spectrometers rely on specific mechanisms to disperse incoming radiation into its component wavelengths and direct it toward detectors. Prism-based dispersion refracts light, separating wavelengths through variations in the refractive index.
Diffraction gratings use periodic grooves to diffract light according to the grating equation, producing discrete spectral lines. These gratings are widely used because of their high spectral resolution and efficiency.
Interferometric dispersion employs devices like Michelson or Fabry-Pérot interferometers, analyzing interference patterns via Fourier transforms. These techniques enable detailed spectral analysis of complex signals.
Energy-selective filters, such as bandpass filters, isolate specific wavelengths by absorption or reflection. They are essential for applications requiring narrow spectral bands.
Wavelength-dependent routing, using optical fibers or mirrors, guides dispersed light to detectors. This routing ensures that each spectral component reaches its appropriate sensor for measurement. Advances in optical routing have further improved the precision and efficiency of spectral analysis.
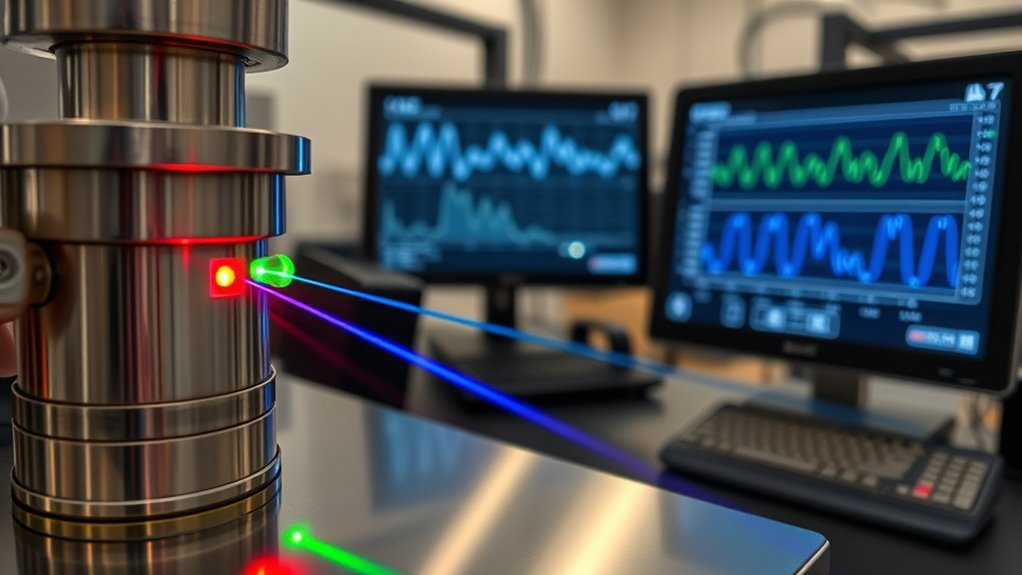
For detection, technologies like gas-filled ionization chambers, scintillation crystals, semiconductor devices, and thermal sensors convert radiation into measurable signals.
These components work together to accurately analyze the spectral composition of the radiation, often utilizing digital signal processing techniques to enhance measurement precision. Additionally, advances in spectrometer calibration improve the accuracy and reliability of spectral measurements.
Key Parameters in Spectral Data Analysis
Understanding key parameters in spectral data analysis is essential for accurately interpreting the frequency content of signals. Frequency resolution lets you distinguish closely spaced frequencies, while spectral resolution depends on the analysis method and data quality.
Mastering key spectral analysis parameters is vital for accurate signal interpretation and reliable frequency detection.
Noise reduction techniques help you minimize unwanted disturbances, improving data clarity. Your sampling rate sets the maximum frequency you can measure, with the Nyquist frequency being half of it.
Selecting appropriate data segmentation enhances spectral resolution and reduces noise, especially when using methods like Welch’s or Bartlett. Accurate frequency calculation relies on the sampling rate, ensuring your spectral peaks reflect real signal components.
These parameters influence your analysis outcomes, enabling you to extract meaningful information from spectral data effectively and reliably.
Relationship Between Spectral Features and Molecular Structure

The spectral features you observe in techniques like UV-Vis, IR, and microwave spectroscopy directly reflect the underlying molecular structure. In UV-Vis spectra, molecular orbitals determine electronic transition energies; conjugation lowers π→π* transition energies, while heteroatoms introduce n→π* transitions. Chromophores produce characteristic absorption bands, influenced by electron density distribution, which affects transition dipole moments. Glycolic acid can also influence spectral features when present in the molecule, as it contains functional groups that may show specific IR and UV-Vis signatures. Understanding molecular orbitals helps in predicting and explaining these spectral behaviors. Additionally, Kia Tuning modifications can alter the electronic environment of molecules, indirectly affecting spectral features by changing electron distribution.
In IR spectra, bond stiffness and bond order dictate vibrational frequencies, with mass and symmetry restrictions affecting IR activity. Hydrogen bonding causes broadening and shifting of bands.
Microwave spectra depend on molecular geometry and moment of inertia, with isotopic substitution altering spectra. Overall, each spectral feature links directly to specific structural elements, allowing you to deduce molecular arrangements and functional groups with precision.
Factors Affecting Spectral Resolution and Sensitivity
Various instrument design parameters considerably influence spectral resolution and sensitivity. You control resolution through slit dimensions; narrower slits improve resolution but reduce signal strength. Diffraction grating groove density determines how well different wavelengths separate, while focal length affects dispersion—longer focal lengths, over 800mm, enable finer resolution, especially in UV regions.
Detector pixel density impacts digital sampling; higher pixel density enhances resolution but may require optical adjustments. Precision in grating rotation guarantees accurate wavelength calibration and repeatability. Optical factors like entrance slit width and grating efficiency affect throughput and signal-to-noise ratio.
Additionally, detector characteristics—pixel well depth, cooling, and sensitivity range—set limits on dynamic range and noise. Signal processing, including A/D bit depth and averaging, refines data quality, influencing overall spectral resolution and sensitivity.
Frequently Asked Questions
How Do Different Types of Spectroscopy Compare in Their Applications?
Different types of spectroscopy serve various applications based on their strengths. For example, atomic emission spectroscopy helps analyze elemental composition, while FTIR identifies material structures in pharmaceuticals.
Raman spectroscopy offers real-time, accurate chemical info, ideal for biomedical diagnostics. ICP-OES detects trace elements in environmental testing.
You choose the method based on your sample’s properties and your specific needs, ensuring precise, efficient analysis across industries.
What Are Common Challenges Faced During Spectral Data Interpretation?
You might find spectral data interpretation more challenging than it seems at first glance. Overlapping peaks can hide crucial details, and biological variability adds complexity to your analysis.
Instrumental issues, like calibration and maintenance, can subtly influence results.
Data processing choices, such as baseline correction or normalization, require careful attention to avoid bias.
Even modeling can trip you up if overfitting or validation missteps occur, making accurate interpretation a delicate balancing act.
How Does Temperature Influence Spectral Measurements?
You see that temperature affects spectral measurements by shifting peak positions, broadening peaks, and changing molecular states.
As temperature rises, absorbance maxima shift down, peaks get wider, and higher energy states populate more.
This can lead to less precise results, especially if you don’t control the temperature.
To guarantee accuracy, you need to monitor and maintain consistent temperatures, calibrate your instruments regularly, and account for these effects during analysis.
What Safety Precautions Are Necessary When Using Spectroscopic Equipment?
When using spectroscopic equipment, you need to follow strict safety precautions. Always wear appropriate PPE like chemical-resistant gloves, safety goggles, lab coats, and closed-toe shoes.
Verify sample compatibility, use sealed containers, and handle chemicals under fume hoods if necessary.
Secure ferromagnetic objects around NMRs, handle cryogens with insulated gloves, and check ventilation systems.
Finally, confirm emergency stops work and keep safety equipment accessible for a safe working environment.
How Can Spectroscopy Be Integrated With Other Analytical Techniques?
You can revolutionize your analysis by integrating spectroscopy with other techniques. Combine methods like IR, NMR, or UV-Vis with microscopy, mass spectrometry, or imaging to access deeper insights.
Hyphenated approaches, like NMR-MS, give you a complete picture from a single sample. Advanced data analysis and chemometrics streamline interpretation, making your results more accurate and extensive.
This integration transforms complex samples into clear, actionable information—changing your research landscape forever.
Conclusion
By understanding the core principles of spectroscopy, you uncover the secrets hidden in light and matter. As you delve into energy levels and spectral lines, you’ll see how molecules tell their stories. Remember, mastering these concepts allows you to read nature’s book without missing a single word. With practice, you’ll navigate the spectrum like a seasoned traveler, turning complex data into clear insights—truly seeing the forest for the trees.